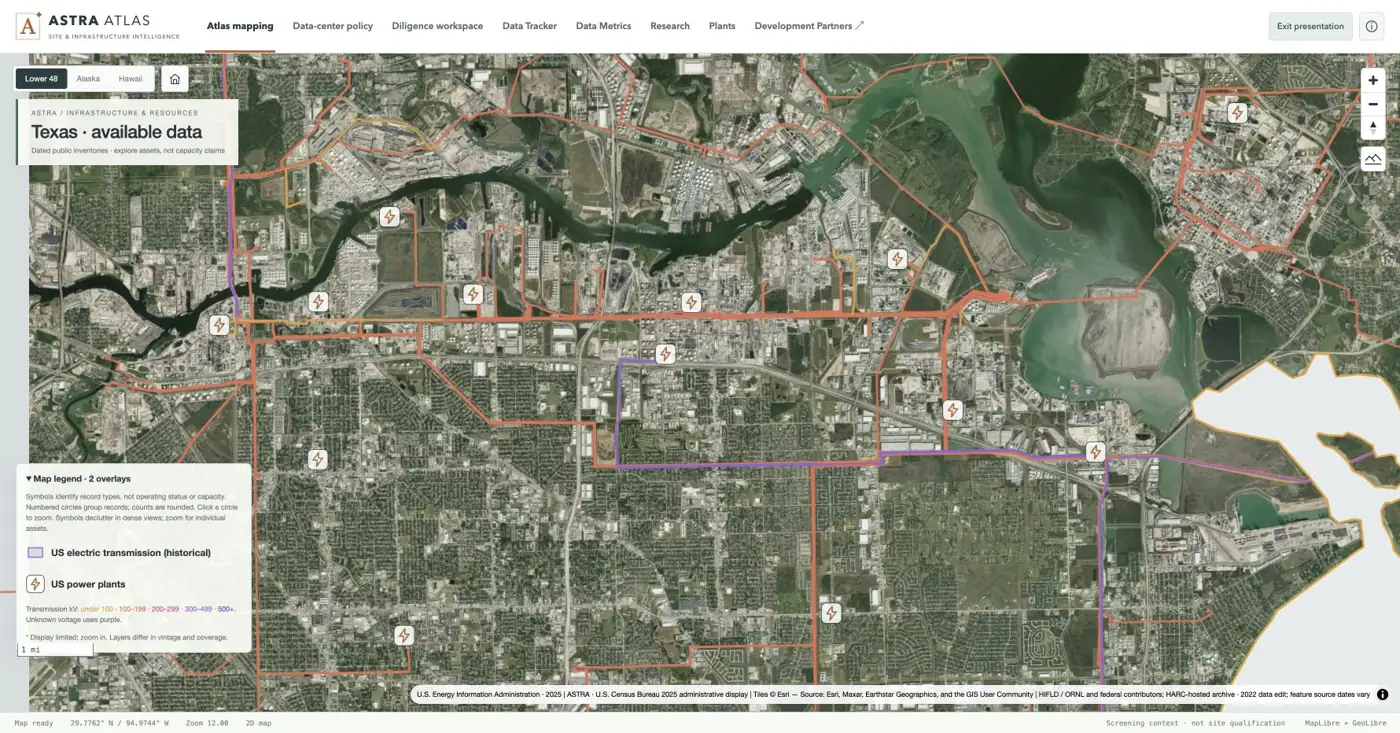
Houston Ship Channel — plant symbols and transmission
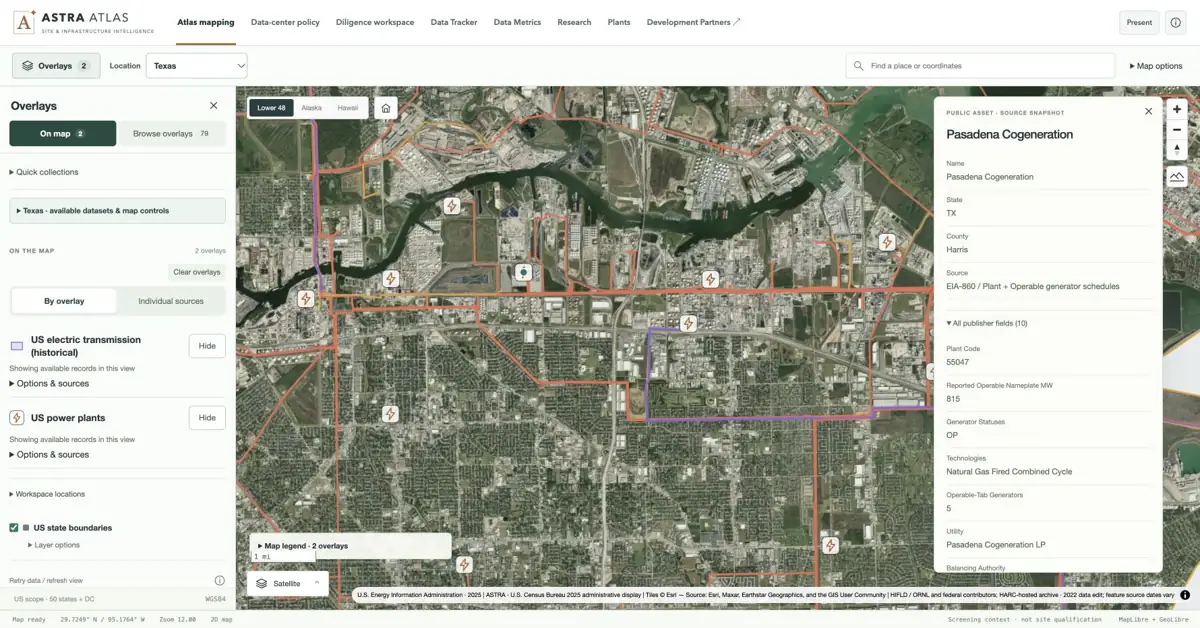
Local satellite view with individual EIA plant icons and historical line geometry across an industrial landscape. Symbols identify source records, not available power.
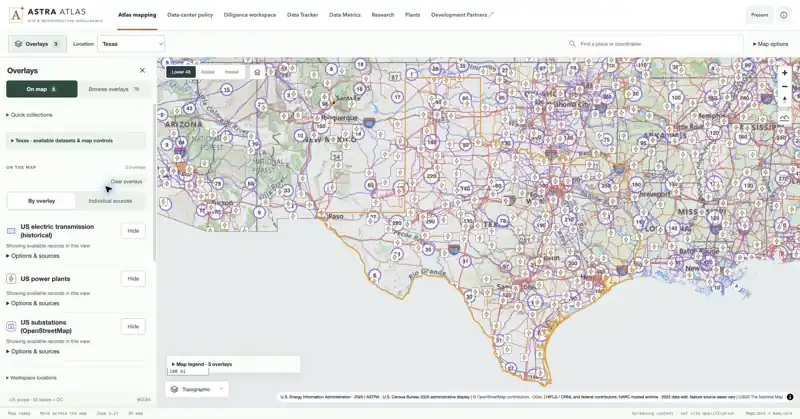
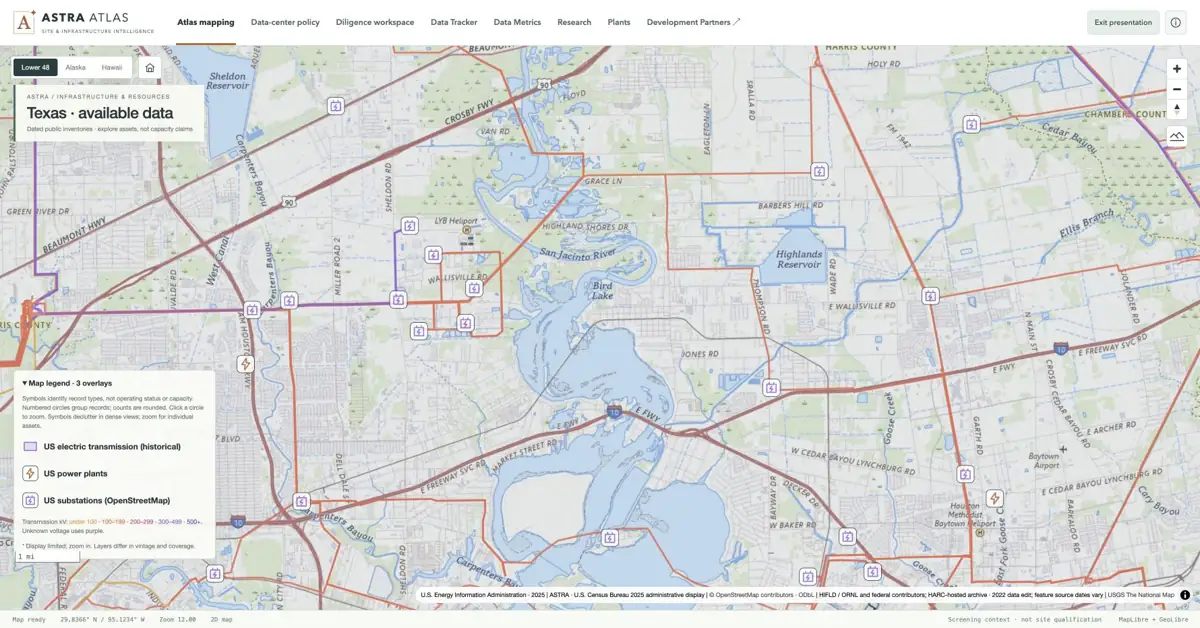
Transmission geometry, EIA plants and OSM substations in a shared view. Historical lines and nearby assets provide context; service availability needs its own evidence.
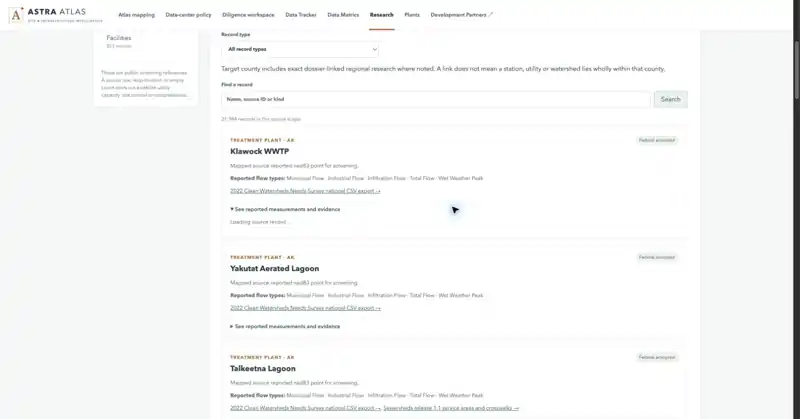
Open reported water measurements and their source qualifications. Research observations help frame diligence; they do not establish available utility capacity.
Source & capture notes
atlas production interface; source definitions and publisher links retained in evidence snapshot.
01 / MINES & QUARRIES
Spot the pattern. Inspect the mine record.
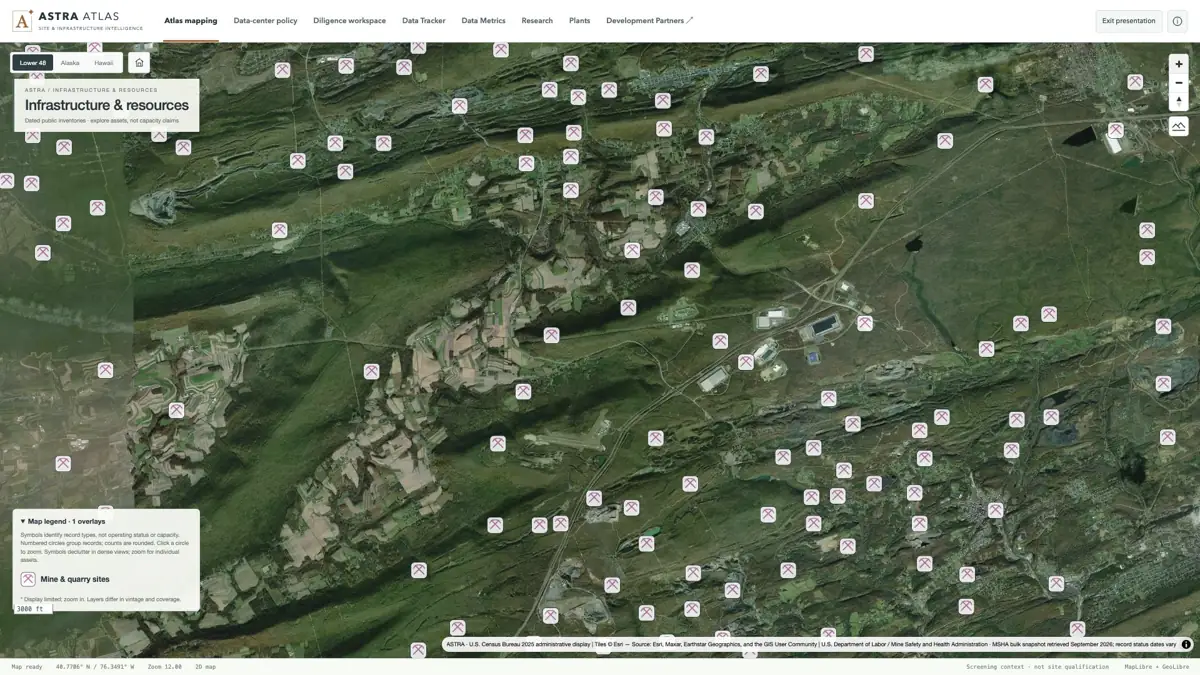
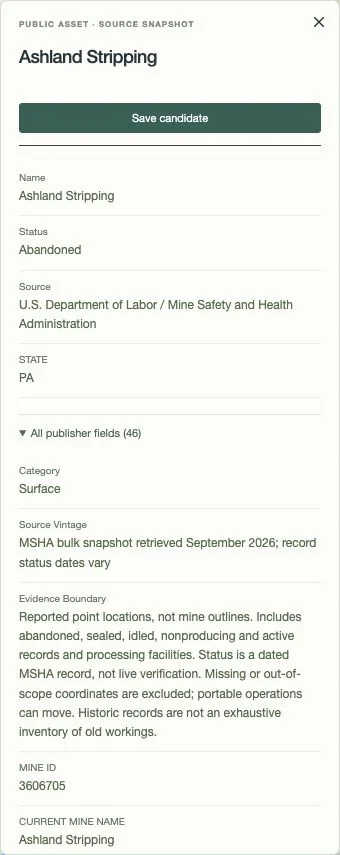
Explore individual mine and quarry records in Pennsylvania’s anthracite region, then inspect a named MSHA record. Source status, classification and location limits stay attached.
Pickaxe symbols identify source records over satellite imagery. The inventory includes active, idled, abandoned and processing-facility records; it does not establish present operations or reserves.
The publisher classifies this as a surface operation and reports “Abandoned.” Its status date is October 21, 1988; the September 2026 retrieval is a separate date.
Source & capture notes
atlas · U.S. Census Bureau 2025 administrative display | USGS The National Map | U.S. Department of Labor / Mine Safety and Health Administration · MSHA bulk snapshot retrieved September 2026; record status dates vary
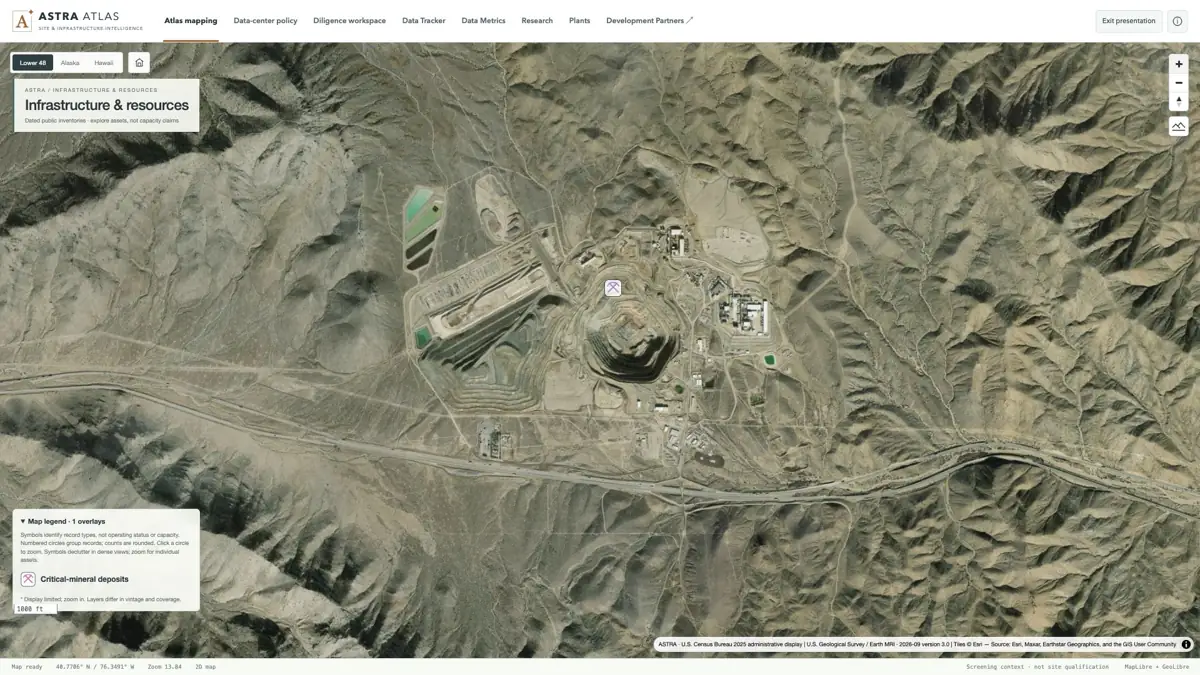
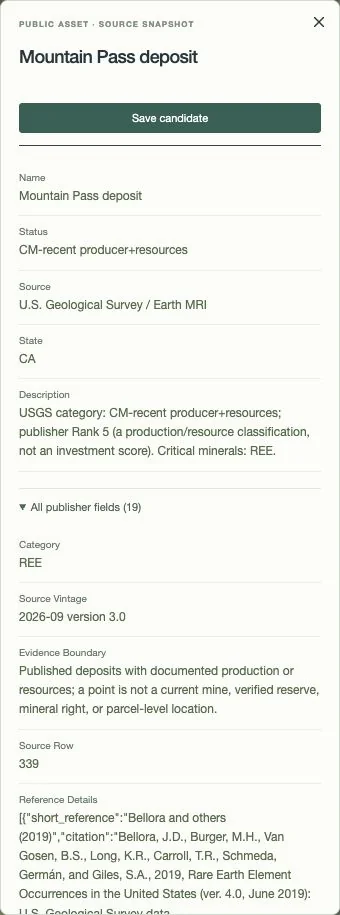
Mountain Pass, California, shown with the September 2026 USGS Earth MRI v3 study isolated. Open its actual record for the rare-earth classification, publisher references and evidence boundary.
A single v3 deposit marker over the mine landscape. Earlier overlapping studies are disabled; the map point does not establish mineral rights or a parcel-level location.
The record reports “CM-recent producer+resources.” Publisher Rank 5 is a production/resource classification, not an investment score; this point is not a verified reserve.
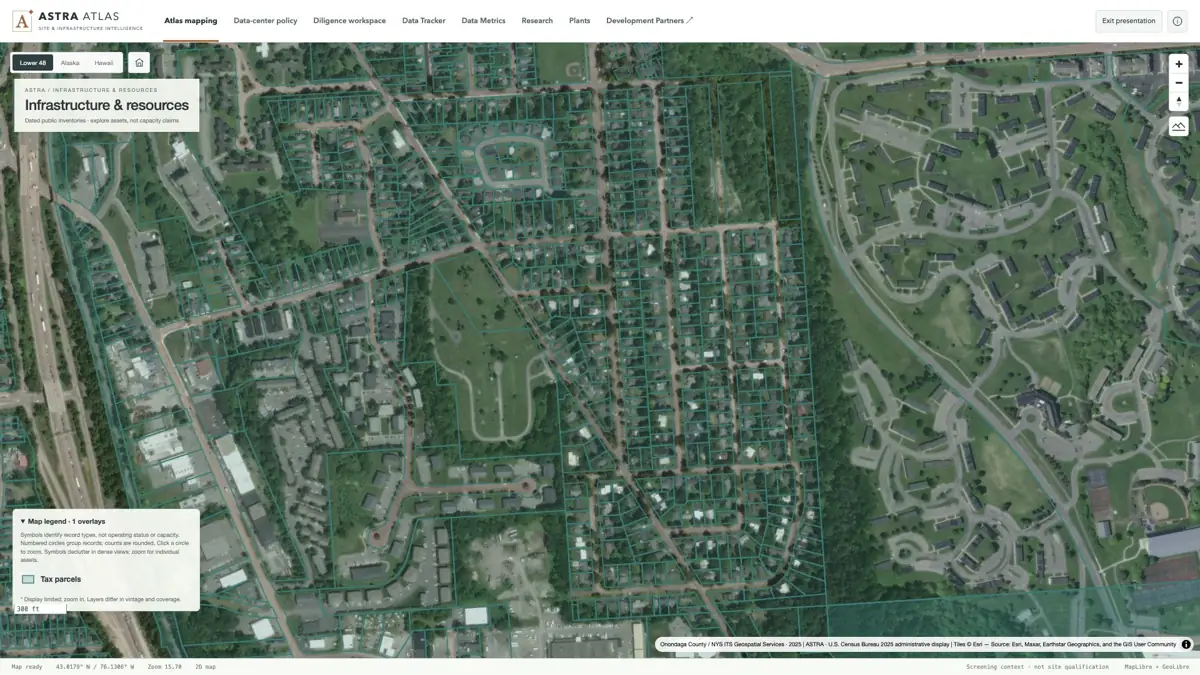
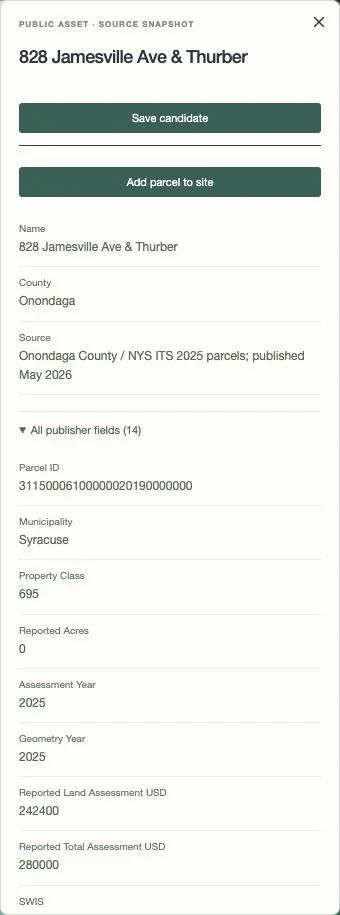
At neighborhood scale, parcel geometry becomes legible. Select a polygon to inspect its identifier, print key, municipality and source years without losing the surrounding landscape.
Actual county geometry over satellite imagery in Syracuse. Selected-county coverage is not a statewide inventory, title survey, ownership verification or land-availability map.
A real assessment/GIS record with 2025 geometry and assessment years, published May 2026. Source assessment values are not market values; the record does not establish developability.
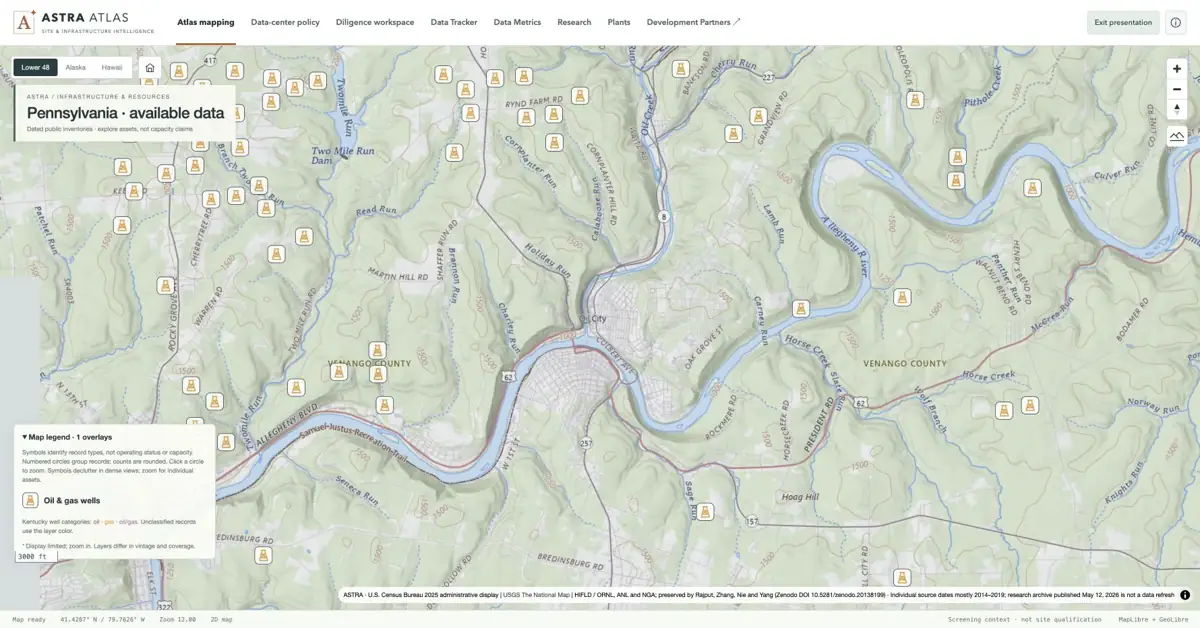
Individual derrick symbols around Oil City. These identify historical source records; they do not establish current production.
Source & capture notes
atlas · U.S. Census Bureau 2025 administrative display | USGS The National Map | HIFLD / ORNL, ANL and NGA; preserved by Rajput, Zhang, Nie and Yang (Zenodo DOI 10.5281/zenodo.20138199) · Individual source dates mostly 2014–2019; research archive published May 12, 2026 is not a data refresh
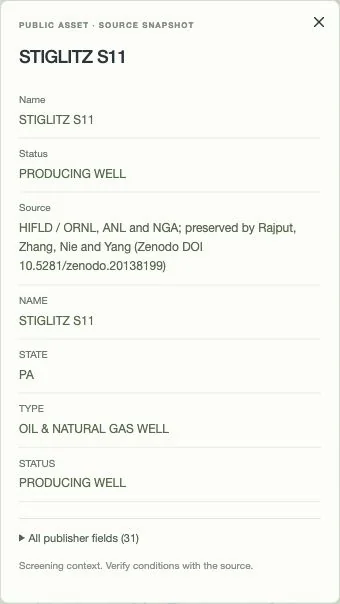
The publisher’s archived “PRODUCING WELL” status is visible. The source remains historical, with current conditions unverified.
Source & capture notes
atlas · U.S. Census Bureau 2025 administrative display | USGS The National Map | HIFLD / ORNL, ANL and NGA; preserved by Rajput, Zhang, Nie and Yang (Zenodo DOI 10.5281/zenodo.20138199) · Individual source dates mostly 2014–2019; research archive published May 12, 2026 is not a data refresh
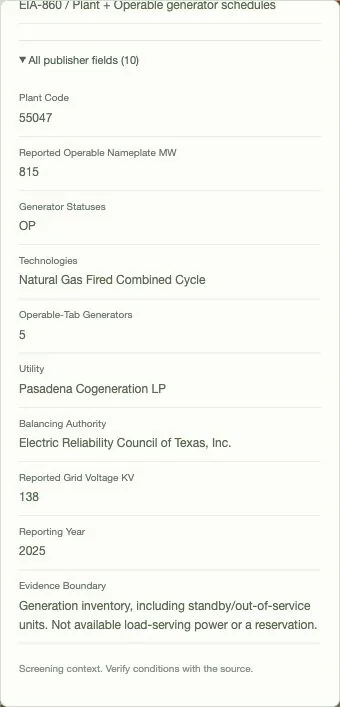
Move from the Houston Ship Channel landscape to Pasadena Cogeneration’s EIA source fields: plant code, technology, generators, reporting year and the measure’s limits.
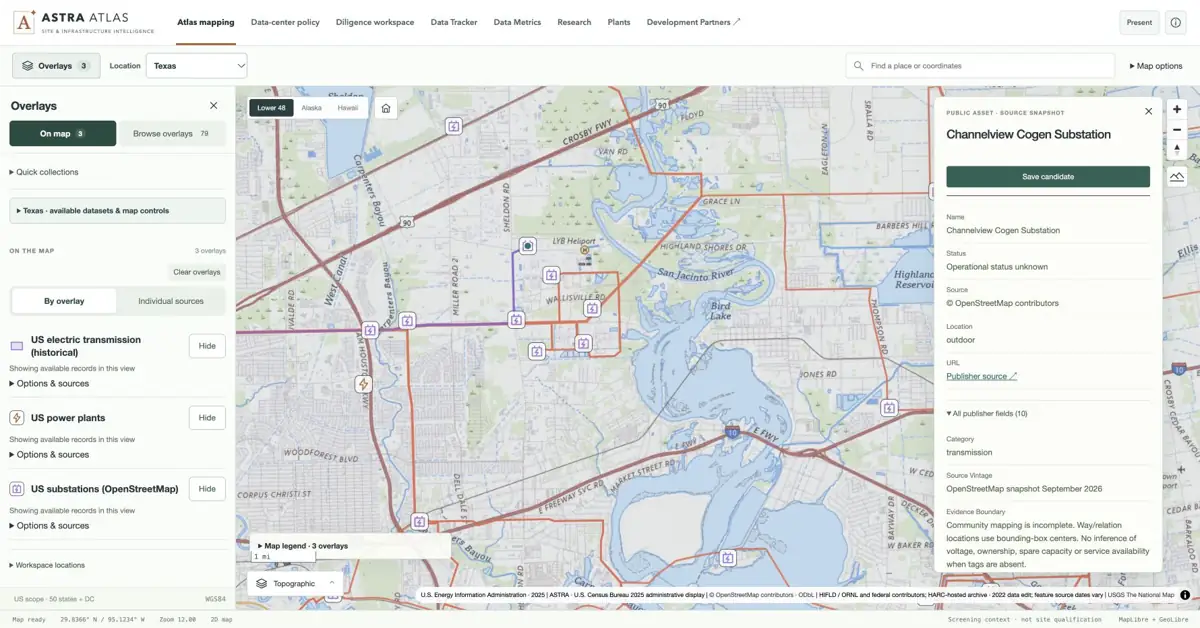
Plant symbols, substations and line geometry share one local view. Open a substation for its source tags; the application keeps operational status and capacity uncertainty explicit.
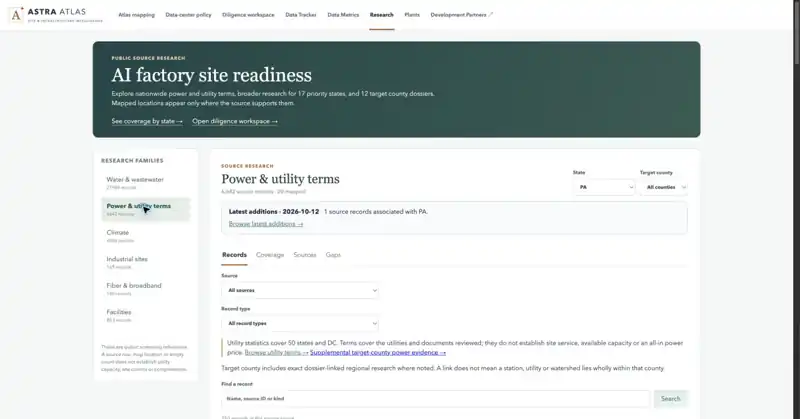
The actual power-research view, with Pennsylvania selected. Published terms and planning references provide a research starting point; site service and an all-in price remain separate questions.
Source & capture notes
atlas production interface; source definitions and publisher links retained in evidence snapshot.
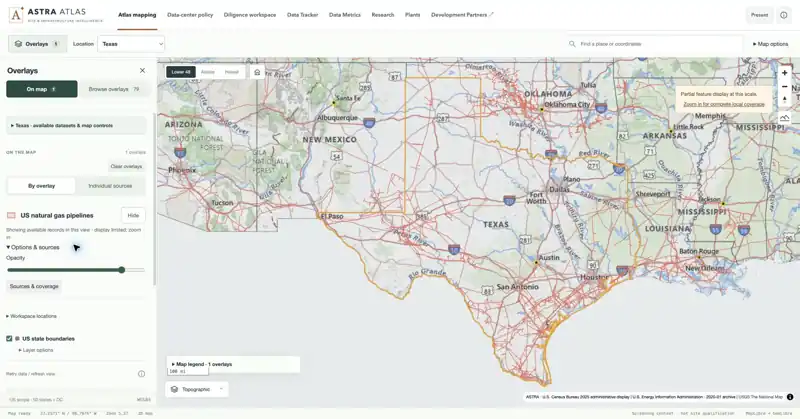
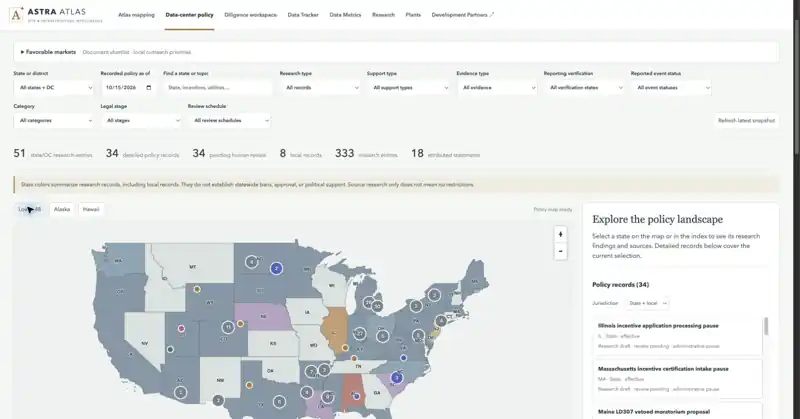
State and local research signals in one national view. Overlapping signals and their as-of date remain part of the record; a map color does not establish approval or a statewide ban.
Source & capture notes
US Census generalized boundaries · atlas official-source research
01Locate
Frame the landscape and its infrastructure.
02Inspect
Open the asset and its publisher fields.
03Qualify
Check the vintage, coverage and conditions.
08 / DILIGENCE & COVERAGE
A stronger starting point. A visible evidence trail.
Understand where the coverage stops, then open a public county dossier to see the research behind a location.
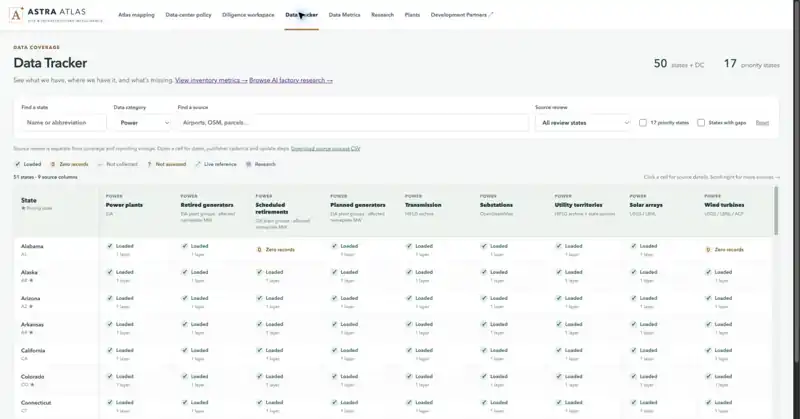
The source tracker distinguishes loaded, zero, uncollected and unassessed. Loaded can still mean partial coverage; a missing observation is not an absence claim.
Source & capture notes
atlas production interface; source definitions and publisher links retained in evidence snapshot.
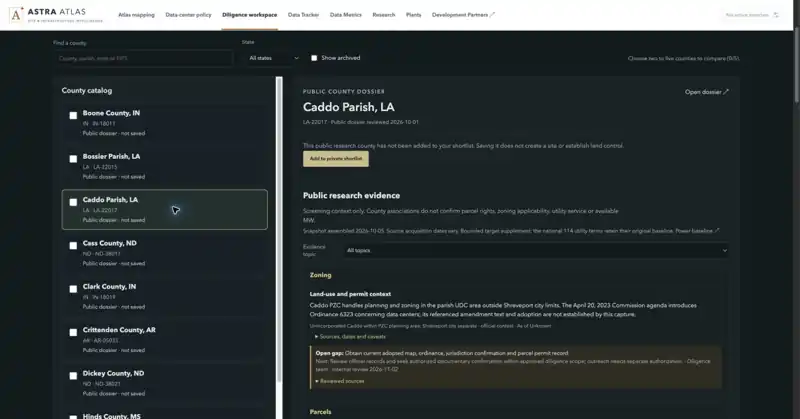
An actual county research view with evidence scope visible. The dossier supports further diligence; it does not establish a saved opportunity, a site commitment or development approval.
Source & capture notes
atlas production interface; source definitions and publisher links retained in evidence snapshot.
Explore coverage in Atlas
Sources & capture provenance
Live application captures / October 15–16, 2026. Native inspector-panel crops are labeled and linked to their full-context frames. Publisher vintages vary.
FROM THE MINERAL DEPOSIT TO THE SUBSTATION NEXT DOOR.01 / SCALE
5.4M+
Mapped source records
5,427,378 in the recorded inventory
483
Mapped source layers
Infrastructure, land and resource context
50
State OSM extracts
Nationwide context; category coverage varies
35K+
Site-readiness observations
35,848 research observations; scopes overlap
Recorded scale / Live installed inventory verified October 15, 2026 (New York); application calculation label October 16. Underlying source vintages vary.
coverage
USGSEIAMSHAState & county dataOpenStreetMapU.S. Census BureauArchived HIFLD / ORNL / Argonne / NGA
A DIFFERENT KIND OF MAPCOVERAGE / 02
Above ground. Below ground. Ahead of the curve.
Power is only part of the story. Follow the pipelines, study the resource landscape and bring the land into focus. The opportunity is in how it all connects.
01 / wells
1.49M
Historical well records
A deep oil-and-gas reference base, with source vintage and location context kept visible.
02 / mineral
265K+
Mineral occurrences & historical sites
USGS MRDS context spanning mineral occurrences, prospects and historical sites.
03 / mine
46K+
Mapped mine & related-facility records
MSHA coal and noncoal records, including mines, mills, quarries and processing facilities.
04 / critical
1,271
Critical-mineral deposit records
A separate USGS September 2026 snapshot—alongside, not combined with, legacy mineral layers.
PUT THE NETWORK IN THE PICTURECONTEXT / 03
Land is a location. Infrastructure is context.
511Kmiles
Transmission geometry
226.5Kmiles
Natural-gas pipeline geometry
617K+records
Parcel records
Distinct measures. Source overlaps and measurement scope are retained.
THE PROJECT / IN A PARAGRAPH
atlas brings over 5.4 million mapped source records across 483 layers into one infrastructure and natural-resources workspace. Explore 1.49 million historical oil-and-gas well records, 46,000+ mapped mine and related-facility records, 265,000+ mineral occurrences and historical sites, and 1,271 critical-mineral deposit records. Drawing on USGS, EIA, MSHA, state and county data, atlas connects the resource landscape with approximately 511,000 miles of transmission geometry, 226,500 miles of natural-gas pipeline geometry and 617,000+ parcel records. See where land, energy, minerals and infrastructure intersect—and turn overlooked context into a sharper next move.
AVON LABS / atlas
Find the overlooked.
The physical world is full of signals. Put them to work.
Inside the numbers Sources, dates & scope+
Source snapshot: Live installed inventory verified October 15, 2026 (New York); application calculation label October 16. Underlying source vintages vary.
Records are source observations, not a deduplicated asset census. Historical wells, mineral occurrences, mine facilities and deposit records do not establish current operations, economic reserves, mineral rights or availability. Mapped mileage includes source overlaps, not unique network or circuit miles. Parcel coverage is limited to selected counties. OSM state extracts do not mean complete coverage of every category. Research observations and mapped records overlap and must not be added. Live application inventory and screenshots were verified October 15, 2026 (New York). This does not establish current serviceability.